The acronym KDD stands for Knowledge Discovery in Databases. KDD process in data mining is an analytical method for finding useful patterns in data for practical applications.
Contents
What is KDD?
Knowledge discovery is one of the most powerful applications of information systems in business. We use KDD to convert useless and often overwhelmingly large data into useful information that can help in decision-making.
Essentially we use data to answer some of the business problems. Consequently, we these insights to meet organizational objectives. You may read in more detail about the significance of data analysis in decision making in our other article. Sometimes data mining is synonymous with KDD. People may use these terms interchangeably.
What are the expectations from Knowledge Discovery?
KDD or data mining is the “process of extracting valid, previously unknown, comprehensible and actionable information from large databases and using it to make crucial business decisions”.
The knowledge discovery process in data mining must fulfill these expectations:
Non-trivial
For instance, if you discover that people who buy luxury apparel are richer than people who don’t buy them. However, if you are able to find out specific life events that may trigger the purchase of luxury products then that knowledge discovery is non-trivial.
Previously Unknown
Secondly, it is also important to discover something new. The analysis is worthless if it provides a piece of stale news to the decision-makers. For instance, your executives may already be aware that your products perform poorly in certain months. Merely finding the same result won’t add any value.
Implicit
This is another important feature of the KDD process in data mining. Essentially there are two types of knowledge – explicit and implicit. Explicit knowledge is often evident and clearly visible without much effort. However, implicit knowledge is embedded inside the data. Implicit knowledge includes the unwritten rules of processes, individual learning. Therefore, they are difficult to mine.
Useful
Finally, and most importantly, knowledge would be useless if it lacks practicality. It is also useless if it is not related to the problem at hand. Therefore, the analyst must sift through the output of data analysis to select only the information that is useful towards the business objective.
Simplified Knowledge Discovery Process

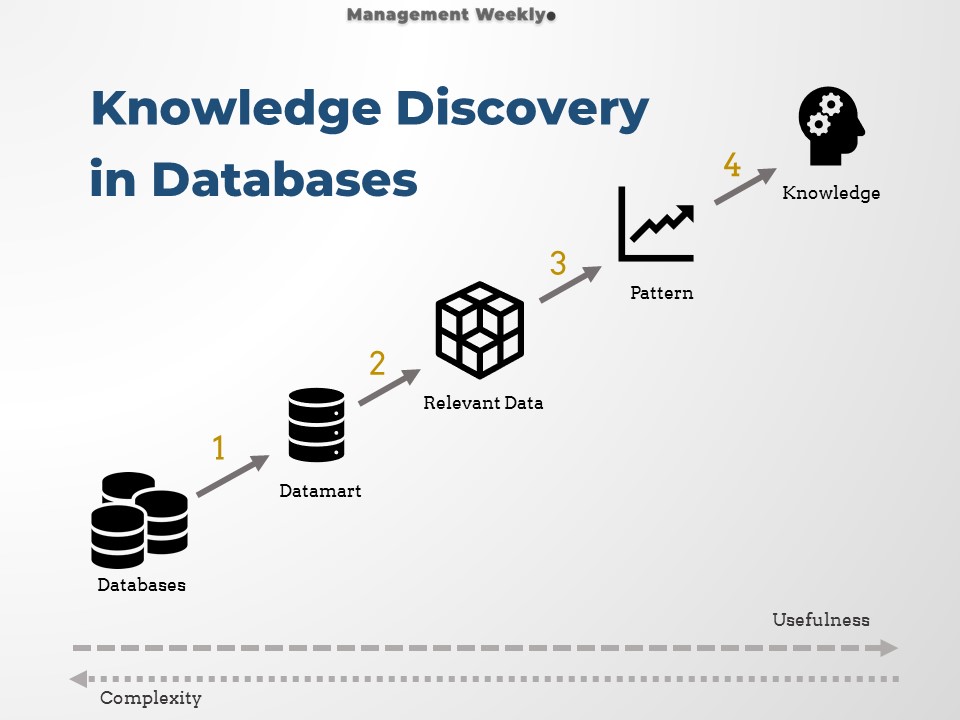
The contemporary approach of extracting knowledge is somewhat different from what is depicted in the traditional KDD diagrams. There is a greater focus on reusability. Analysts must not start the process again from scratch. Therefore firms put a lot of effort into developing data marts that take a lot of time initially. However, we can do queries and data extraction more efficiently. Also, we should do data cleaning and transformations in the initial phase itself. That eliminates the need for this process later.
- Data Extraction, cleaning, transformation and loading process. In the first stage, we extract the data. Subsequently, we clean and prepare it for loading into the data marts. The dimensions are transformed into the required format before it is loaded into datamart.
- Second stage is extraction of useful and relevant data from the datamart. Relevant data is extracted by running queries on the datamart. These queries provide us with a subset of the data in the datamart.
- The third stage is to analyze the data. In this stage, the data is sliced, diced, summarized. We may also use the data to build statistical models.
- In the final stage the output is represented in human consumable format. Typically, the business executives require insights in the form of tables, charts and infographics. This information can either be presented on-demand or in the form of customizable KPI (Key Performance Indicators) dashboard.
KDD Process in Data Mining
Databases
A database is defined as “an organized collection of structured information, or data, typically stored electronically in a computer system” (Oracle.com). The most important concept here is the structured nature of the information. It is very difficult to make sense of unstructured data, especially when the dataset is large.
However, databases have certain problems which inhibit their usage for data analysis. Firstly, it takes a lot of time to run queries* on databases. Secondly, Datamart is specific to business usage. Therefore, they are more efficient and they cost much lower to be implemented. Thirdly, required data can be scattered in different databases. If we have all the relevant data in one place, it makes the analysis both efficient and faster.
🛈 Sidenote: Queries are like commands that enable us to work on the database
Datamart
ETL process helps in building data marts from data warehouses. A data warehouse is a collection of inter-related databases. There may be different sources of data. Operational data, transactional data, customer data are some of the examples of different databases that can be accumulated at the Data warehouse. The data goes through the ‘extraction’ stage where the data from different sources are collected. The ‘transformation’ stage ensures that data is cleaned, processed, and standardized. Finally, the data is loaded into the data warehouses.
In some cases, these data warehouses may be an intermediate stage, and then it is again used to prepare the datamarts. On the other hand, sometimes data can be directly used to prepare the datamarts. These are also known as enterprise data warehouses or EDW. Therefore, the data warehouse is like a single source of truth, where did require data from different sources are collated and put together. However, we should not run queries on EDW directly. These tables usually contain a lot of data columns that may not be useful for analysis. Therefore, we create smaller, manageable, and analysis-oriented databases. These are called data marts.
Relevant Data
Once we have the required data marts in place, we can extract the relevant data from the datamart. This data can be used for analysis. Let us consider a simple example to illustrate this step in the KDD process in data mining.
You are interested in knowing the top-selling products in a store. Therefore, you run a query to extract a table that contains the point-of-sale data. Each row containing only the product name, SKU number, product category, quantity, unit cost, and total cost. Thereafter you may analyze the data to get useful output from them.
Pattern
The pattern is nothing but a useful output you get from the analysis. We may use an appropriate statistical method to work on the extracted data. These patterns represent the trends in data. For instance, let’s say that you have got some data points for sales in our particular shop. In that case, the pattern of sales will reveal that the weekends perform better than weekdays. However, this kind of simple pattern is not very useful. The reason for this is that anybody, even without the analysis, can say that weekends are better than weekdays because there is higher footfall. Therefore, there will be higher sales.
Consequently, we have to put in some more effort to find out patterns that are nontrivial. Therefore, we may have a deeper look at data and try to see that which of the weekdays are performing better than others. A further drill down in this data gives us that Fridays perform the best while Tuesdays perform the worst. This kind of insight would be much more useful because it gives us a starting point to design our marketing campaigns to boost sales.

Knowledge
The patterns are then interpreted as knowledge. There should be novelty and usefulness in this knowledge. This knowledge is essentially visualized from the patterns that we get. We can represent the output of data analysis both visually as well as textually. Visual representation is in terms of tables, graphs, charts, and diagrams.
Subsequently, we make sense out of this data and try to answer the business problem that we had posed in the first step. Again, we need to ensure that the insights that we have developed through the knowledge discovery process are non-trivial, novel, and useful. Also, this is not the end of the KDD process in data mining. Further, we have to use this information to fine-tune our models and iteratively find certain solutions which are not available on the first try.
Some advanced concepts in KDD
Data Scrapping
Data scraping refers to the process of collecting information from sources like websites and blogs. Companies may collect data from these kinds of sources for different purposes. This data is used for analysis. Typically, data scrapping is done using automated scripts or software.
For example, let us consider that you want to understand why some of your products are selling better than others. Also, you sell the product both on your own website and on Amazon. You may want to scrap the reviews from Amazon’s website. You can collate all these reviews together and do sentiment analysis on your products. This can help you understand what are the reasons that drive the sales of well-performing products and what are the reasons that inhibit the sales of poor-performing ones.
Data Stream Mining
Data streams are sources of data where data is characterized by continuity. Unlike traditional data which is non changing, these types of data streams offer continuously changing data points. One of the common examples of this kind of data would be weather data. The second example of this kind of data could be data emanating from IoT sources.
One of the biggest challenges with our data stream is the extreme volume of data. For instance, if you’re collecting data from an IoT sensor, the first step would be to minimize the burden of data. You may take an average of sixty readings in a minute and only store temperature data for every minute. This will not only help you reduce the storage requirement; it will also make analysis more meaningful as it may even out random fluctuations in the sensor.
Social Media Data
Knowledge discovery can also happen from social media data. Social media is set to be one of the richest sources of customer’s voices. However, this kind of data is difficult to procure. Moreover, it is also difficult to analyze. One of the distinctive characteristics of social media data is that it is unstructured data. People can share posts that are textual or it could be images or it could be videos or any other format.
The non-standardized nature of this data makes it difficult to be analyzed using traditional data analysis software. You may use special software like Hadoop, Apache Storm, or Google BigQuery for this kind of analysis. However, not all social media data is unstructured and some analysis may be done directly on the content.
