Pricing is one of the most puzzling aspects of product management. How do you price the product right? The van Westendorp pricing model can help you with this question. Here’s how:
Contents
Why ‘pricing’ is difficult?
Pricing is one of the four Ps of the marketing mix. Pricing is extremely difficult. Other aspects of marketing are driven by well set out rules and approaches. Other the other hand pricing is difficult. Firstly, it is not easy to understand what people are ready to pay for your product. Secondly, there is no correct answer to this question. A price that is suitable for one person may not be suitable for another. Thirdly, it needs to be dynamically adjusted to internal and external factors. For instance, these factors may change the minimum price for breaking even.
Here is the pricing dilemma :
- If you price the product too low, you tend to lose potential revenue. In fact, you can run into losses. This can happen if you are not able to cover the cost of the goods sold. At the very least you tend to lose revenue.
- If you price the product too high, you tend to lose customers. Also, sometimes, the market is a monopoly. In these cases, people may be forced to buy your product. However, they will have a dissent against the product. These customers may defect at the first opportunity.
This is where the van Westendorp pricing model comes handy. However, let us first look at the classical model. Secondly, we shall see what are the limitations of this model.
Classic economic model (and its limitation)
We have studied the elasticity graph in our Economic 101 course. It tells us that as the price increases, there is a drop in demand. Let us briefly have a look at the graph. Thereafter, let us understand how this method is inadequate for managers.
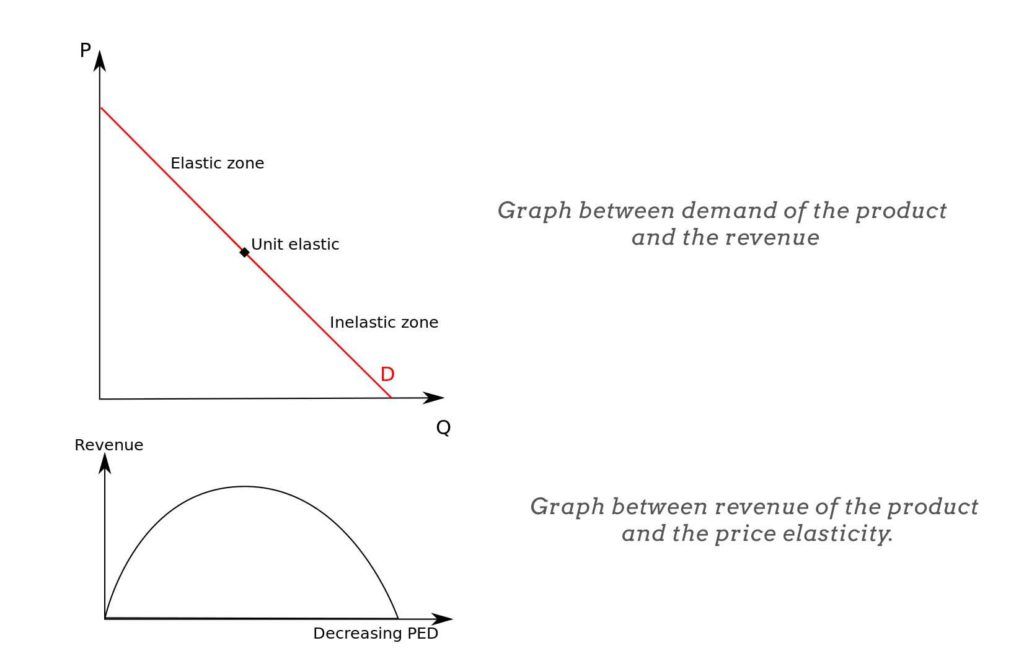
Image from Wikimedia commons
The classic elasticity of demand curve models the change in the quantity demanded per unit change in price. It’s formula is:
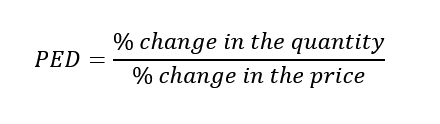
Some limitations are:
- It cannot be used to determine the price for products that are needed in single or less quantity.
- It does not track the nature of change accurately. PED over the price changes as it is non-linear as seen in the graph.
- It does not tell us a range where pricing should give us maximum sales.
van Westendorp pricing model
Peter van Westendorp was a Dutch economist. He came up with the model for finding the desired range of pricing for the products. It looks like an economic model. However, it finds usage in market research. The model is also known as the Price Sensitivity Model or PSM. It is a direct and robust method for pricing.
Some assumptions of this model:
- People have an understanding of the value of the product.
- Pricing is a distinctly important feature. That is we do not focus on changes in the valuation of a product as the feature set changes.
Overview of this model
Although the approach seems too mathematical, it is easy. There are only three simple steps. If you follow these steps, you will get the results.
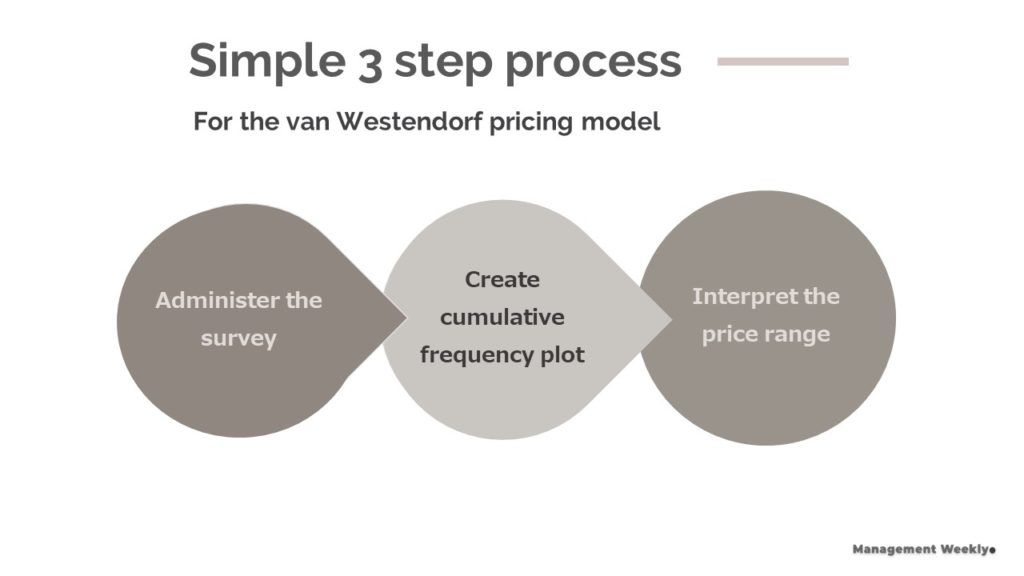
3 simple steps for van Westendorp pricing model. A detailed explanation is provided in the next sections.
- Administer the survey
There are four questions in the core survey. You can augment the core questions with additional questions. The core questions help us get the price preferences of people.
- Create the cumulative frequency plot
The cumulative frequecy plot is a chart that shows the total response for each question. Let us say there are 40 people who have said they like a price of $200 or less then we plot 40.
- Interpret the results
Once the graph is plotted, we can see the points of intersection of the four lines. This gives us the appropriate ranges of prices.
van Westendorp pricing model survey
These are the four questions. Firstly, we ask them that at what price they would start questioning the legitimacy of the product. For instance, let us say they are used to buying a bottle of shampoo for $18. If a company sells the product for $12 it may excite the customer. However, if the price is $6 they may question the quality.
Secondly, we ask people about the best price. Let us call this the bargain price. For example, the customer may be delighted to buy a new brand of comaprable shampoo for $12. This is the bargain price.
Thirdly, we also set out to see the upper bounds for the price window. The customers start thinking that the price is expensive at some price point. It is important to keep the prices less than or equal to this.
Fourthly, the final question is about the highest price that the customer is willing to pay. It is important to capture this price point becuase of few reasons:
- Customers may not be truthful about the expensive price point. This extra data gives us more flexibility of interpretation.
- In a low competition situation it may help to price the product higher to get more revenue from the product.
- The point of ‘too expensive’ can be quite useful for luxury products. Customers that want luxury products may have higher satisfaction paying close to this price point.
Four core questions of the Price Sensitivity Meter
- At what price do you think the product/service is priced so low that it makes you question its quality? (minimum price)
- At what price do you think the product/service is a bargain? (bargain price)
- At what price do you think the product/service begins to seem expensive? (expensive price)
- At what price do you think the product/service is too expensive? (very expensive price)
van Westendorp pricing model example: pricing for electric cars
Now let us consider a real-life example. We will refer to the research paper published in a top tier academic journal. Larson et. al., (2014) published a paper on pricing for electric vehicles. They wanted to study attitude about electric vehicles between different groups of people. The cumulative frequency plot represents the response for experienced users.
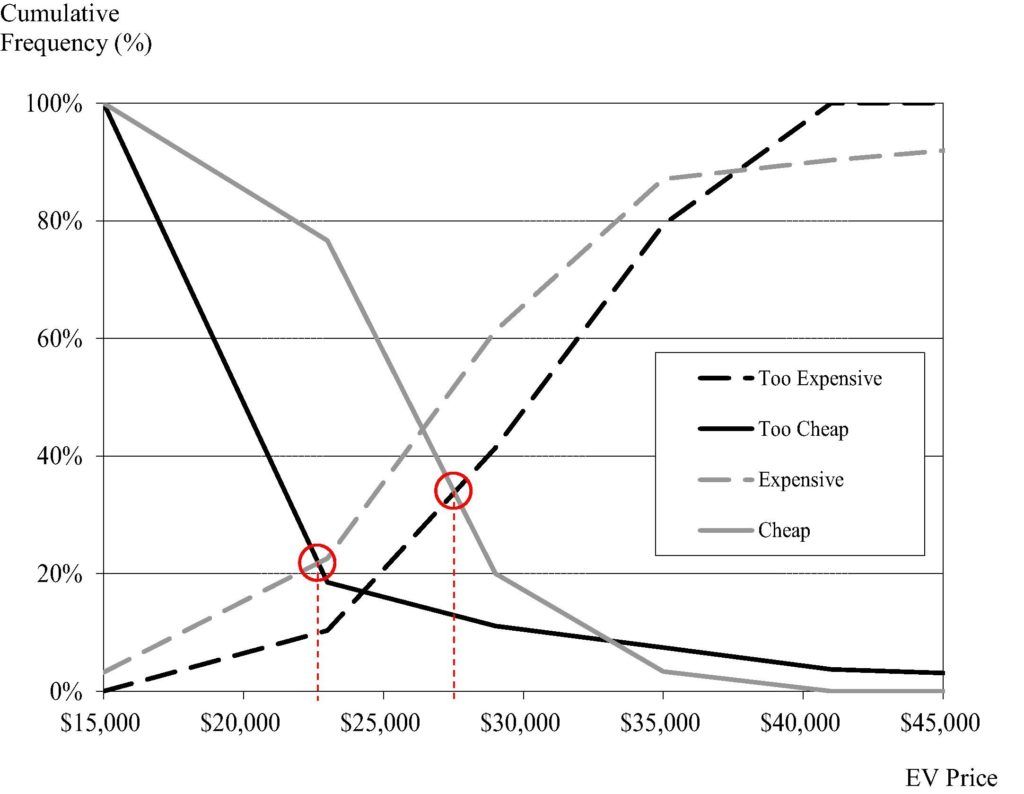
An interpretation of this chart
- The optimum price range would be $22,000–27,500
- People do not expect the electric cars too be too cheap. It is evident from the solid black line in the graph.
- People are somewhat ready to pay a higher price too. This is evident from the plot of dotted black line.
FAQs
1. The pricing results are more realistic compared to other models.
2. A range of answers gives higher confidence in the results than a single price.
3. The van Westendorp model has higher explainability than other methods like the conjoint analysis.
4. Cheaper and faster method.
1. Qualitative interview: we can ask the customers about their preferences and through open-ended questions get them to reveal the price ranges that they are comfortable with.
2. Conjoint analysis: this method is more suited when we are also interested in designing the product. Product versions with certain attributes would be more acceptable than others.
3. Price laddering: in this method, the respondents are given a price point, and then it is raised or lowered. This gives the marketers an idea of a comfortable price range. However, research shows that it is not as accurate as of the van Westendorp price sensitivity model.