
This is a short, non-mathematical guide to multiple regression (linear). However, let us first introduce regression as an intuitive concept. We shall discuss some real-life situations. Keeping it as simple as possible for the nontechnical readers to follow. If you face any difficulty, please feel free to comment on your doubts in the comment section below.
Contents
What is Regression?
Regression is a statistical tool to describe the relationship between different variables. It finds a lot of applications in different areas of management like marketing, project management, finance, and even human resources.
Let us take a very simple example. Consider that you are an ice-cream seller. A vital variable for you would be the total number of ice-creams sold every day. Now, you may also consider factors that drive sales. Firstly, it could be temperature. You would sell more ice-creams on a hotter day than on a colder one. Secondly, sales would depend on the price too. When the price of ice-cream increases, there would be lower sales.
Therefore, we can say that the sales is a function of the day’s average temperature and the price of ice-cream. Therefore, we say that temperature and retail price are the input variable and sales is the outcome variable.
Intuitively we can say that as the price increases, the sales will decrease. Conversely, as the price of ice-cream will decrease, more people will be willing to buy it. However, statistics become useful as they provide more insights than mere intuition.
Understanding the regression model as set of relations
Let us consider the total sales as S and the average temperature as T.
S = mT
Here m signifies whether the sales will increase or decrease with the change in temperature. Through our experience we can say that relationship is positive. In other words, as temperature increases, the sales increases.
Also, we have the following relation between sales and retail price, P:
S= nP
Here, situation is slightly different. We know that as the price would increase, the sales would decrease. Therefore, n is a negative number.
Another important thing to remember is that sign of these numbers signify whether the output increases or decreases as the input variable increases or decreases. On the other hand, the magnitude(how big the number is) signifies whether the increase will be a slow one or a steep one.
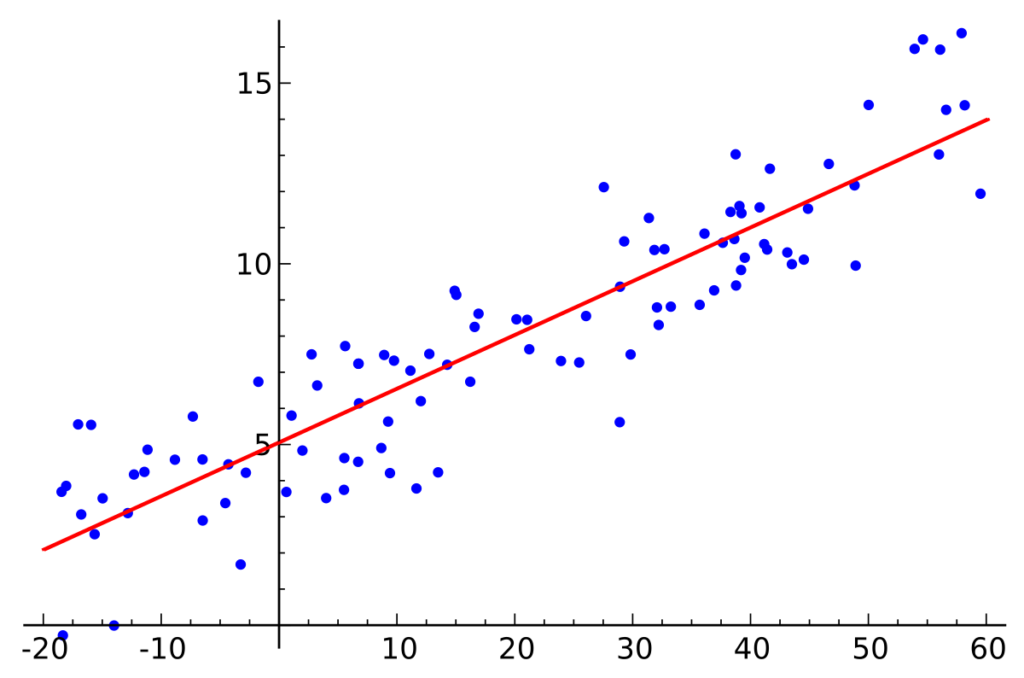
There is one thing missing from the relation S = mT or nP to make it a regression equation. This is a constant called the intercept. Less us call this ‘i’. Why is this required? See the graph below. Even when the temperature is zero, still there will be people who will buy the ice-cream as some people prefer ice-cream even in winter.
Regression equation: linear regression
Our model is a linear regression model. Linear models assume that the relationship between variables will be varying directly with one another. On the other hand non-linear models also include different powers of the variables.
S = i + mT (1)
S = j + nP (2)
Regression equation : S = i + mT
Multiple regression: Linear
Multiple regression is just an extenssion of linear regression we saw earlier. Here we will combine equations 1 and 2. This gives us the multiple regression as follows: Here we will combine equations I
S = k + mT + nP
Here we can model the relationship between temperature, price, and sales in one single equation. Let us assume that we find the value of m as 0.2 and n as –0.3. This means that for every 1-degree rise in temperature there will be an increase in the sale of 0.2 ice-cream. In other words, for every 5-degree rise in temperature, we will sell 1 more ice-cream.