
A lot of companies closed down because they don’t have enough cash to pay for their liabilities. This necessitates certain measures to analyze the financial situation of a firm. Let us take a look at one of the most commonly used financial ratios. Current Ratio interpretation can also give us a way of predicting any major problems that can lead to catastrophic failure of the firm.
Contents
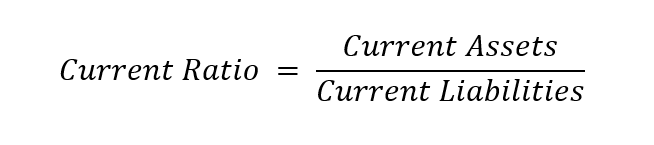
The formula for Current Ratio
The current ratio is calculated by dividing the current assets by the current liability. It is important to note that both of these are “current”. This means that the assets and the liabilities are supposed to be met in the short run. Typically we take a period of less than a year. When a firm has the ability to pay back in the short term, we say that it has higher liquidity. Some of the liquid forms of money are bank balance and easy to sell investments. On the other hand, assets such as a factory may not be easy to sell to cover immediate requirements.
What are examples of Current Assets?
- Cash
- Assets that are equivalent to cash
- Easy to trade investments
- Account receivables
- Raw materials
What are examples of Current Liabilities?
- Accounts payable
- Deferred payments
- Fees and taxes
- Short term loans
How to interpret the Current Ratio?
| Current Ratio range | Interpretation | Corrective measures |
| More than 1 | Company has more than enough liquidity to clear the short term liabilities | No corrective measures required. |
| Approximately 1 | The company has just enough liquidity to clear the short-term liabilities | No corrective measures required |
| Less than 1 | Company may not be able to pay for the short term liabilities | Need to observe the current liabilities carefully and try to cut expenses to pay the liabilities before it gets much lower. |
Another important aspect is that what is considered a ‘good’ current ratio and what is a ‘bad’ one? It completely depends on the industry.
| Current Ratio | Industry | Example |
| Less than 1 is alright | Retail, Goods trade | Costco, Target, Big Bazaar |
| Higher than 2 is alright | Real estate, Textile, Software | Brookfield Asset Management, Prologis, TCS |
| Higher than 5 is alright | Animal Husbandry, Agriculture | China Modern Dairy, Clifton Hills |
Factors that impact the Current Ratio
There are two factors that impact this ratio, current assets, and current liabilities. Firstly, let us discuss the current assets. Some of the important controllable factors are raw material and inventory. Inventory can be both work in progress as well as finished goods inventory. A company can attempt to go leaner in its production to reduce the material and work stuck in progress. This material and inventory is essentially money that is stuck. Therefore, a shorter cycle time of converting raw material into finished goods will also improve the current ratio.
For example, we may compare the current ratios of a highly optimized production system like Toyota with respect to a highly performance-oriented production like Ferrari. While Toyota has a CR of 1.5, Ferrari has a CR of around 4.7.
Additionally, firms may work around CR as well. Expensing vs Capitalizing can play a role in ‘adjusting’ the CR. Therefore the interpretation of the current ratio may not be very accurate.
Common mistakes in Current Ratio interpretation
- Never compare CR for companies from different industries. It can be misleading
- A higher CR is not always better and a lower CR is not always bad. It is only an indicator and we need to look into the current assets and current liabilities to understand it better.
- The Current Ratio is not the same as Acid Test or Quick Ratio. QR takes into account only the easily liquidated assets like cash and does not include the inventory.